This project sought to convey the global devastation brought about by the COVID-19 pandemic, as well as the policies countries around the world employed to battle to the virus. The dataset used in this project was generated by the data team at Our World in Data, and was collected on December 14, 2022.
Exploratory Data Analysis
Preliminary ingestion of the collected data was done using pandas. The dataset was made of 242678 rows and 67 columns, and the fields were grouped into the following tables:
- demographics (e.g., population, country GDP, median age)
- cases (e.g., total cases, new cases, new cases per million)
- deaths (e.g., total deaths, new deaths, new deaths per million)
- tests (e.g., total tests, positive test rates, tests per case)
- hospitalization (e.g., number of patients, weekly admissions)
- vaccinations (number of vaccinated people, total boosters)
- mortality risk factors (e.g., smokers by gender, life expectancy)
- policy (e.g., stringency index, handwashing facilities)
These tables were imported into a MySQL database, for further exploratory data analysis. As a foreign-born citizen of Canada, I was particularly interested in comparing the effects the pandemic had on Africa and North America. Consequently, I built SQL queries to determine:
- the total number of cases and deaths across various continents, especially Africa and North America
- the likelihood of dying if you contract COVID in Canada vs. my birth country Cameroon
- the normalized death rate in Canada vs. Cameroon
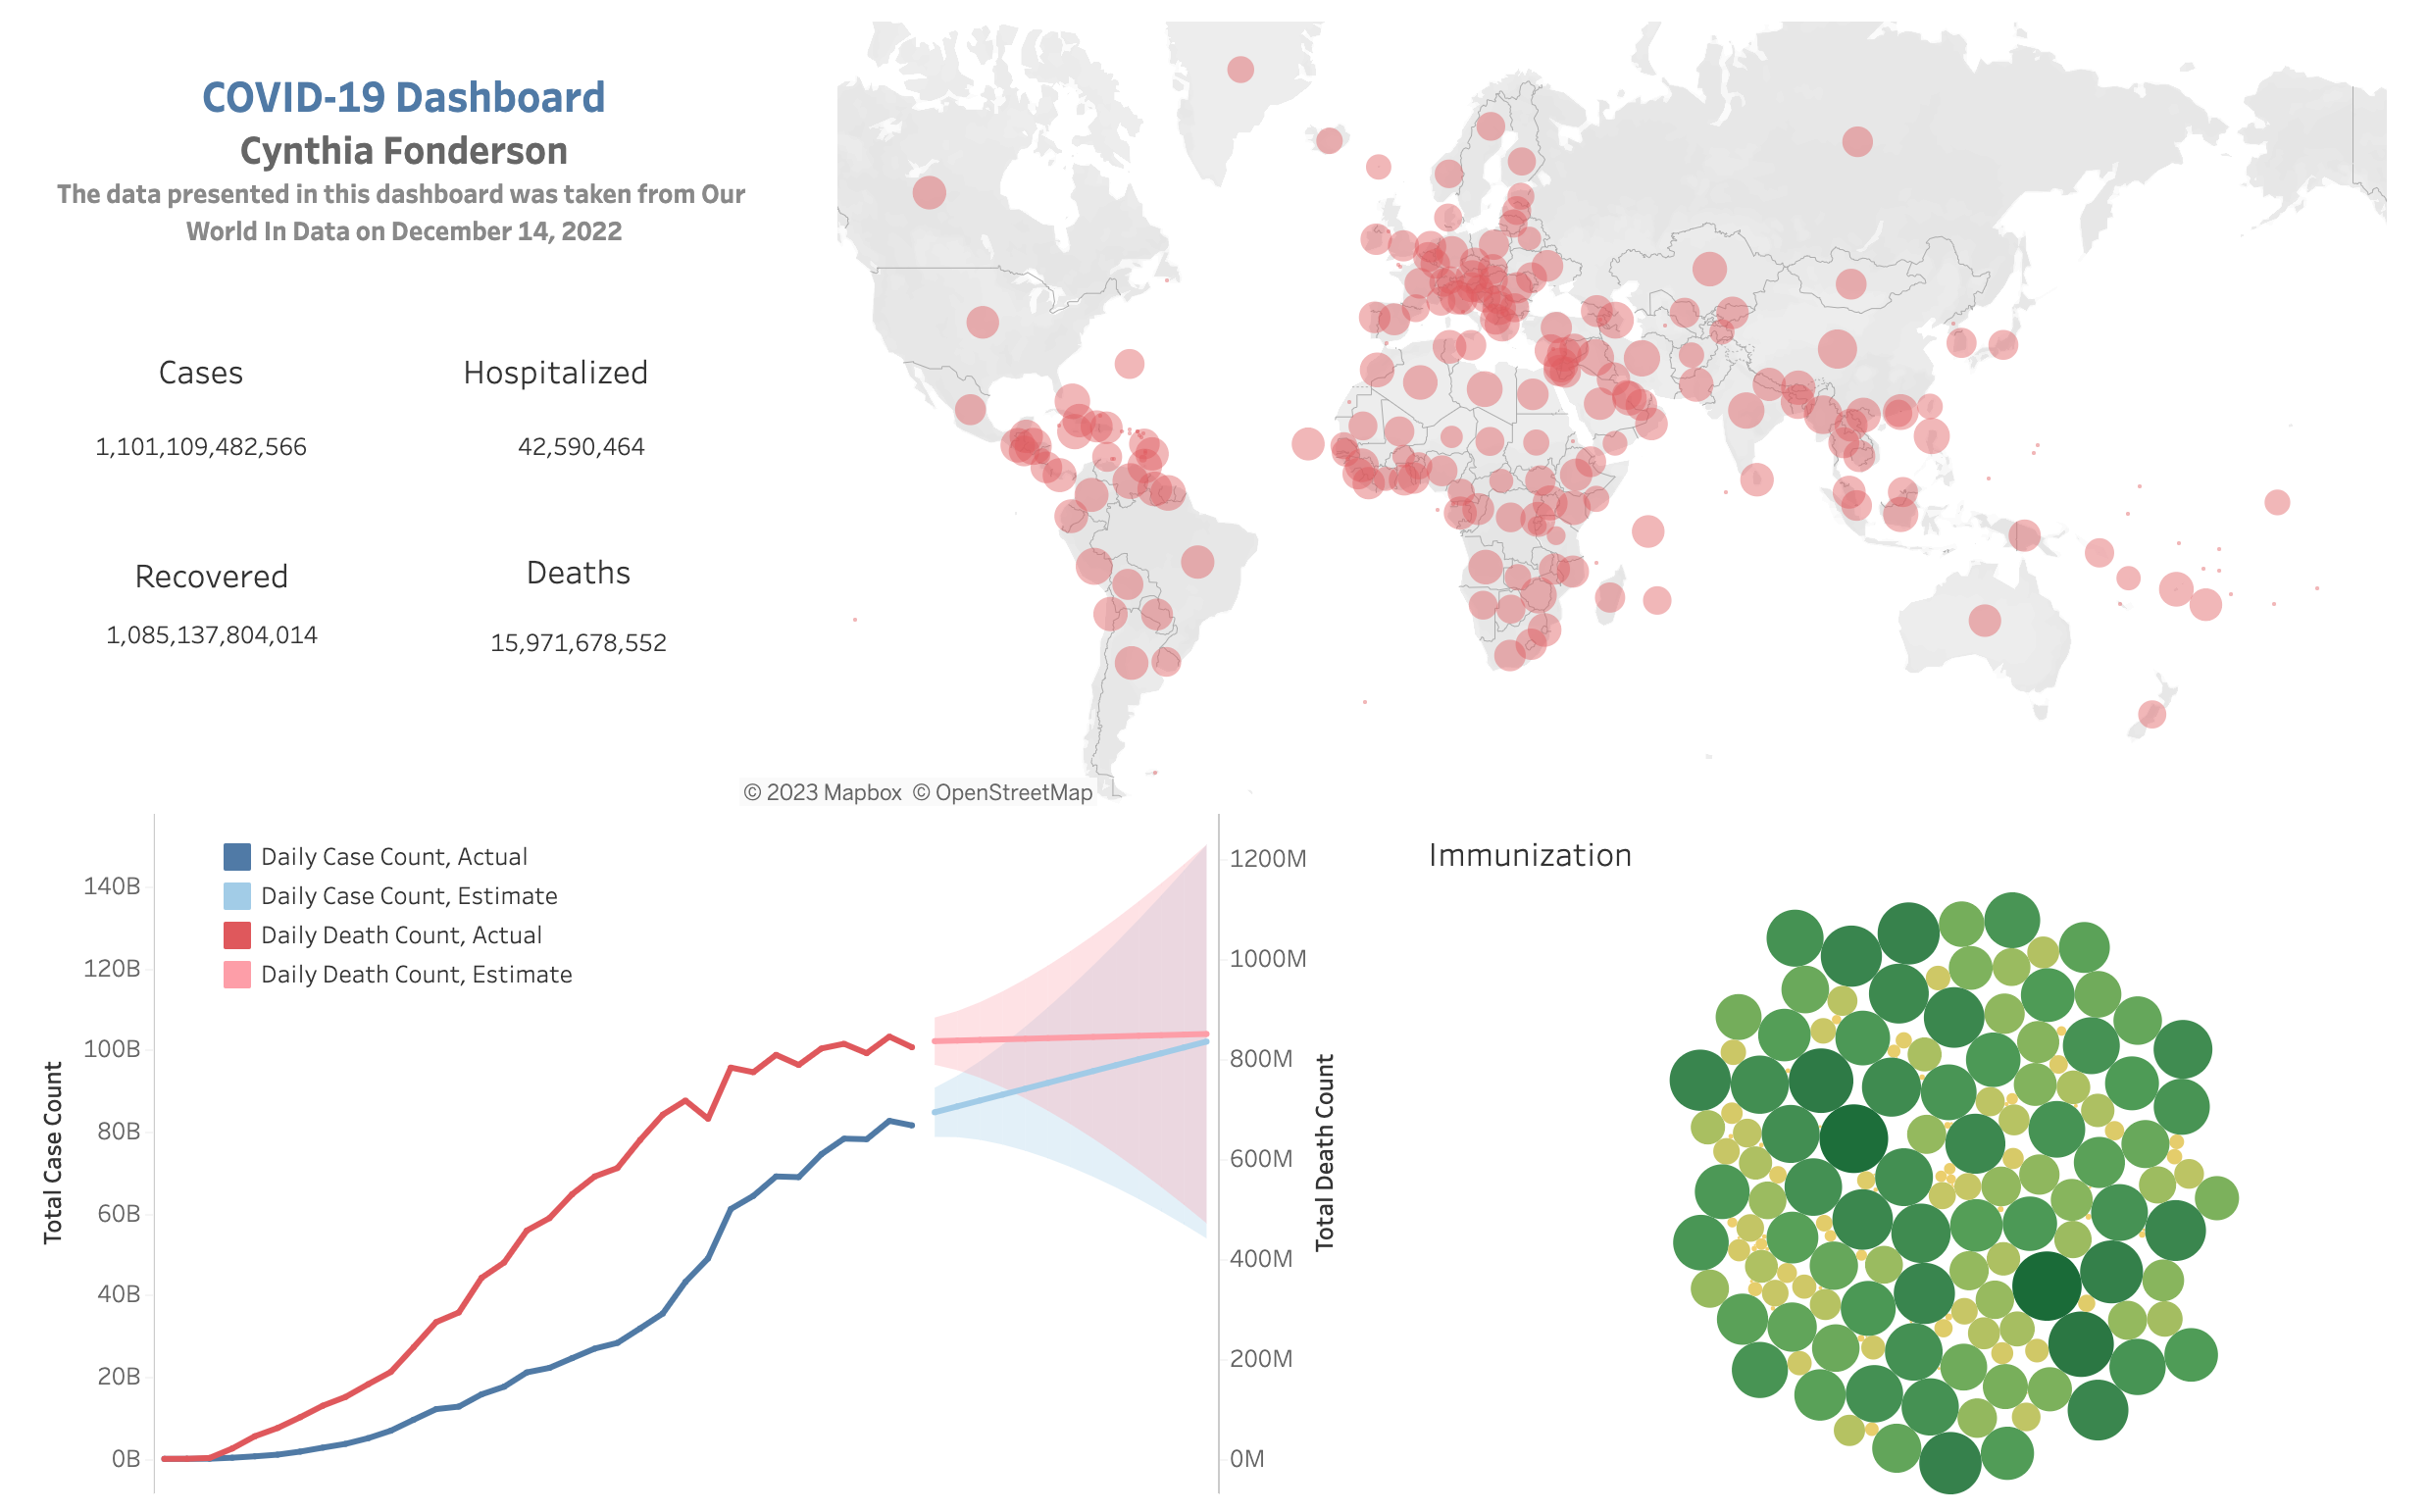
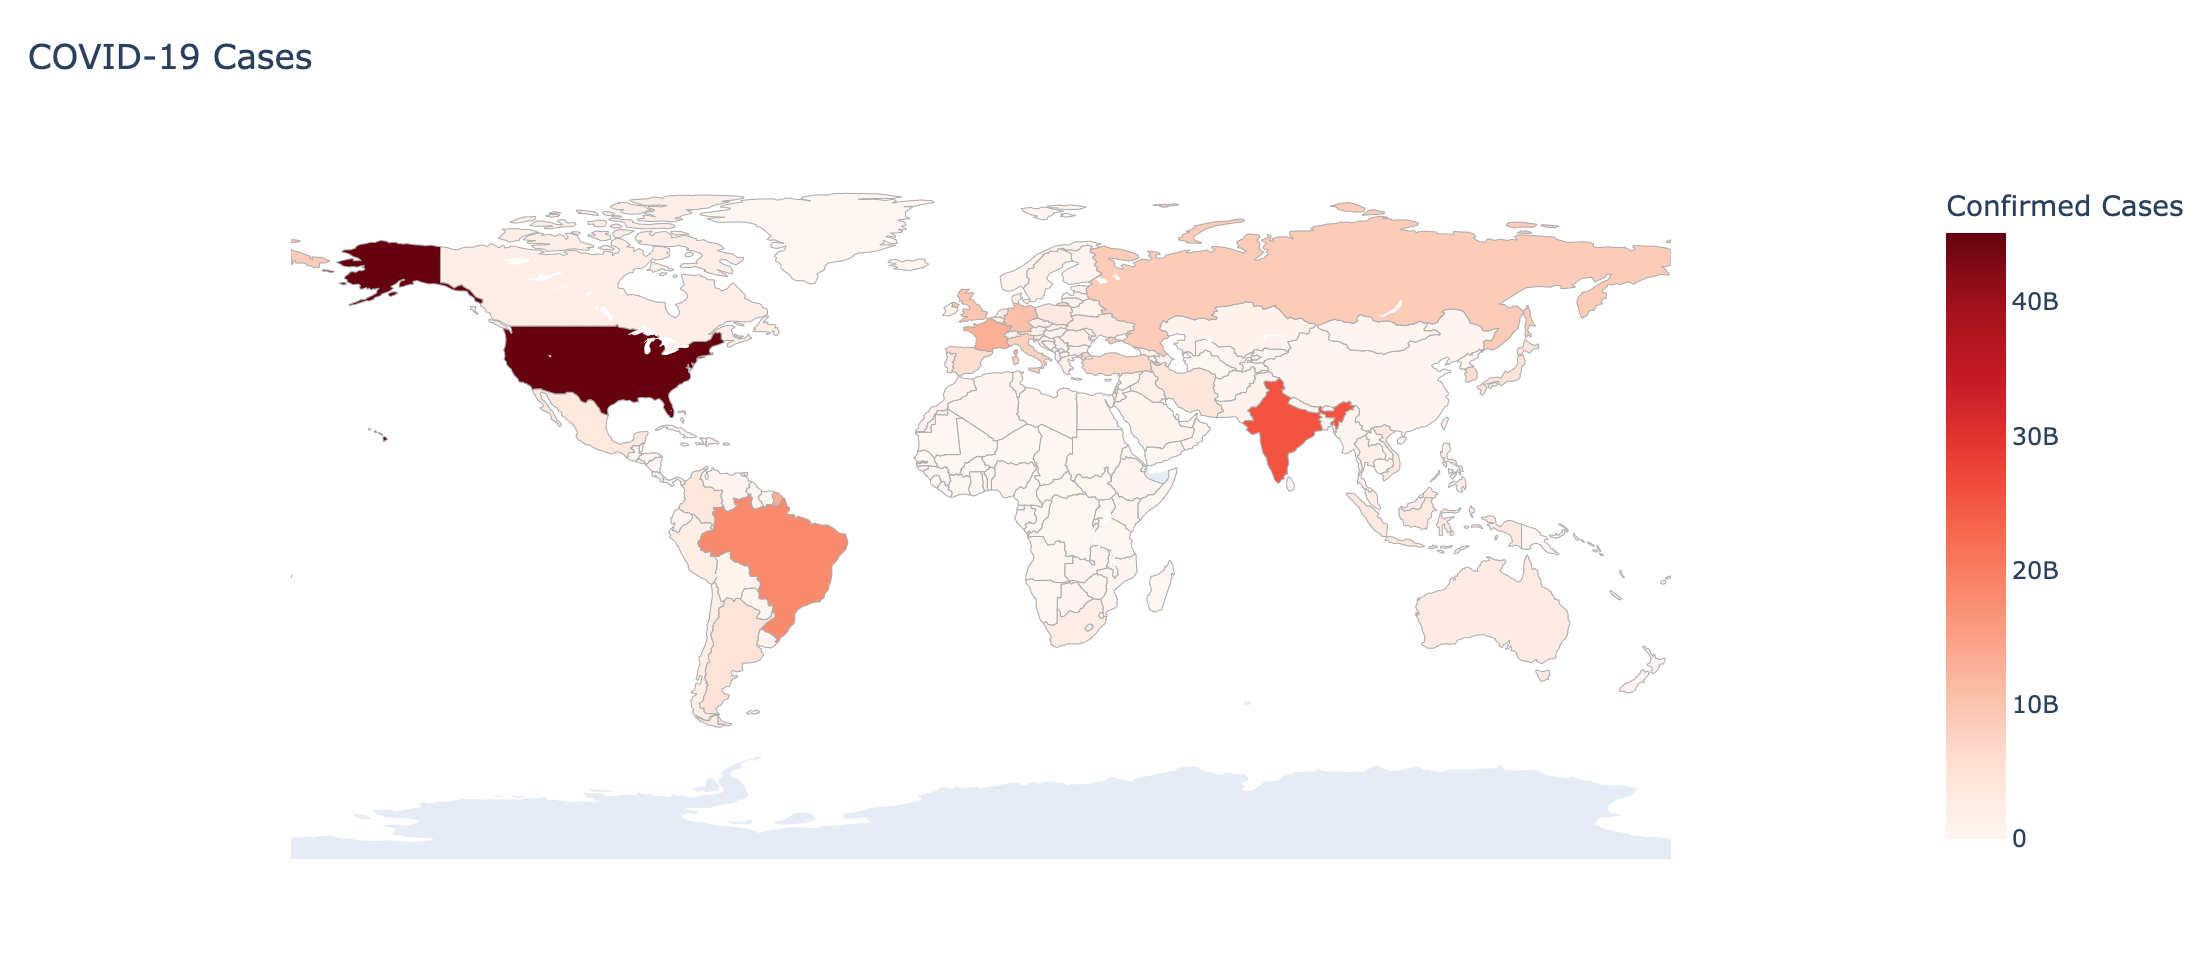
Globally, I wanted to know the continents with the highest death counts, see the advancement of the disease on a daily basis and the immunization efforts made by countries around the world. Following EDA, I also created preliminary visualizations within the jupyter notebook to give me an idea on dashboard design and execution, including choropleth maps and time series data (shown below). The full code for the EDA and preliminary data visualization here.
Dashboard
For this project, a simple, but interactive dashboard was built using Tableau.