Starting September 2019, the city of Calgary embarked on a two year pilot project to introduce bike and scooter sharing services. The aim of this pilot was to support the goal of creating a bicycle friendly city, as stated in the City of Calgary’s Cycling Strategy from 2011. The Cycling Strategy has four measurable goals that indicate a “more bicycle friendly city” which are;1
- Get more people cycling.
- More bicycle infrastructure.
- Safer cycling.
- Increased satisfaction with cycling in Calgary.
With the goal of becoming the next premier cycling city in North America, the City’s approach includes three pillars, one of which is Plan, Design and Build. Within this pillar, prioritization of pilot projects and Public bike share systems were highlighted, which has led to our highly recognizable Neuron and Bird e-scooters and e-bikes across the city.1 Going forward, we will call this form of transportation micromobility.
This project aims to assess the adoption of bicycle- and scooter-sharing programs as flexible and accessible micromobility solutions for Calgary residents, using trip data recorded during the pilot phase. Additionally, it seeks to identify high-traffic areas and recurring commute patterns to optimize future micromobility resource allocation.
The Data
The data was provided by The City of Calgary and is organized in a table containing information about the time, location, distance and duration of each trip taken during the pilot (datafile).The dataset includes all dockless scooter and bike trips logged in Calgary’s peak summer months of July 1, 2019 to September 30, 2019. Observations have been excluded from collection if they did not meet the distance criteria of greater than 100 meters or duration criteria of greater than 30 seconds, leaving 482,021 observations publicly available. The data was collected in a structured, tabular form with 17 columns, including eight string variables, five integer variables, and four float variables.
The Results
Part 1: Pilot Adoption Assessment
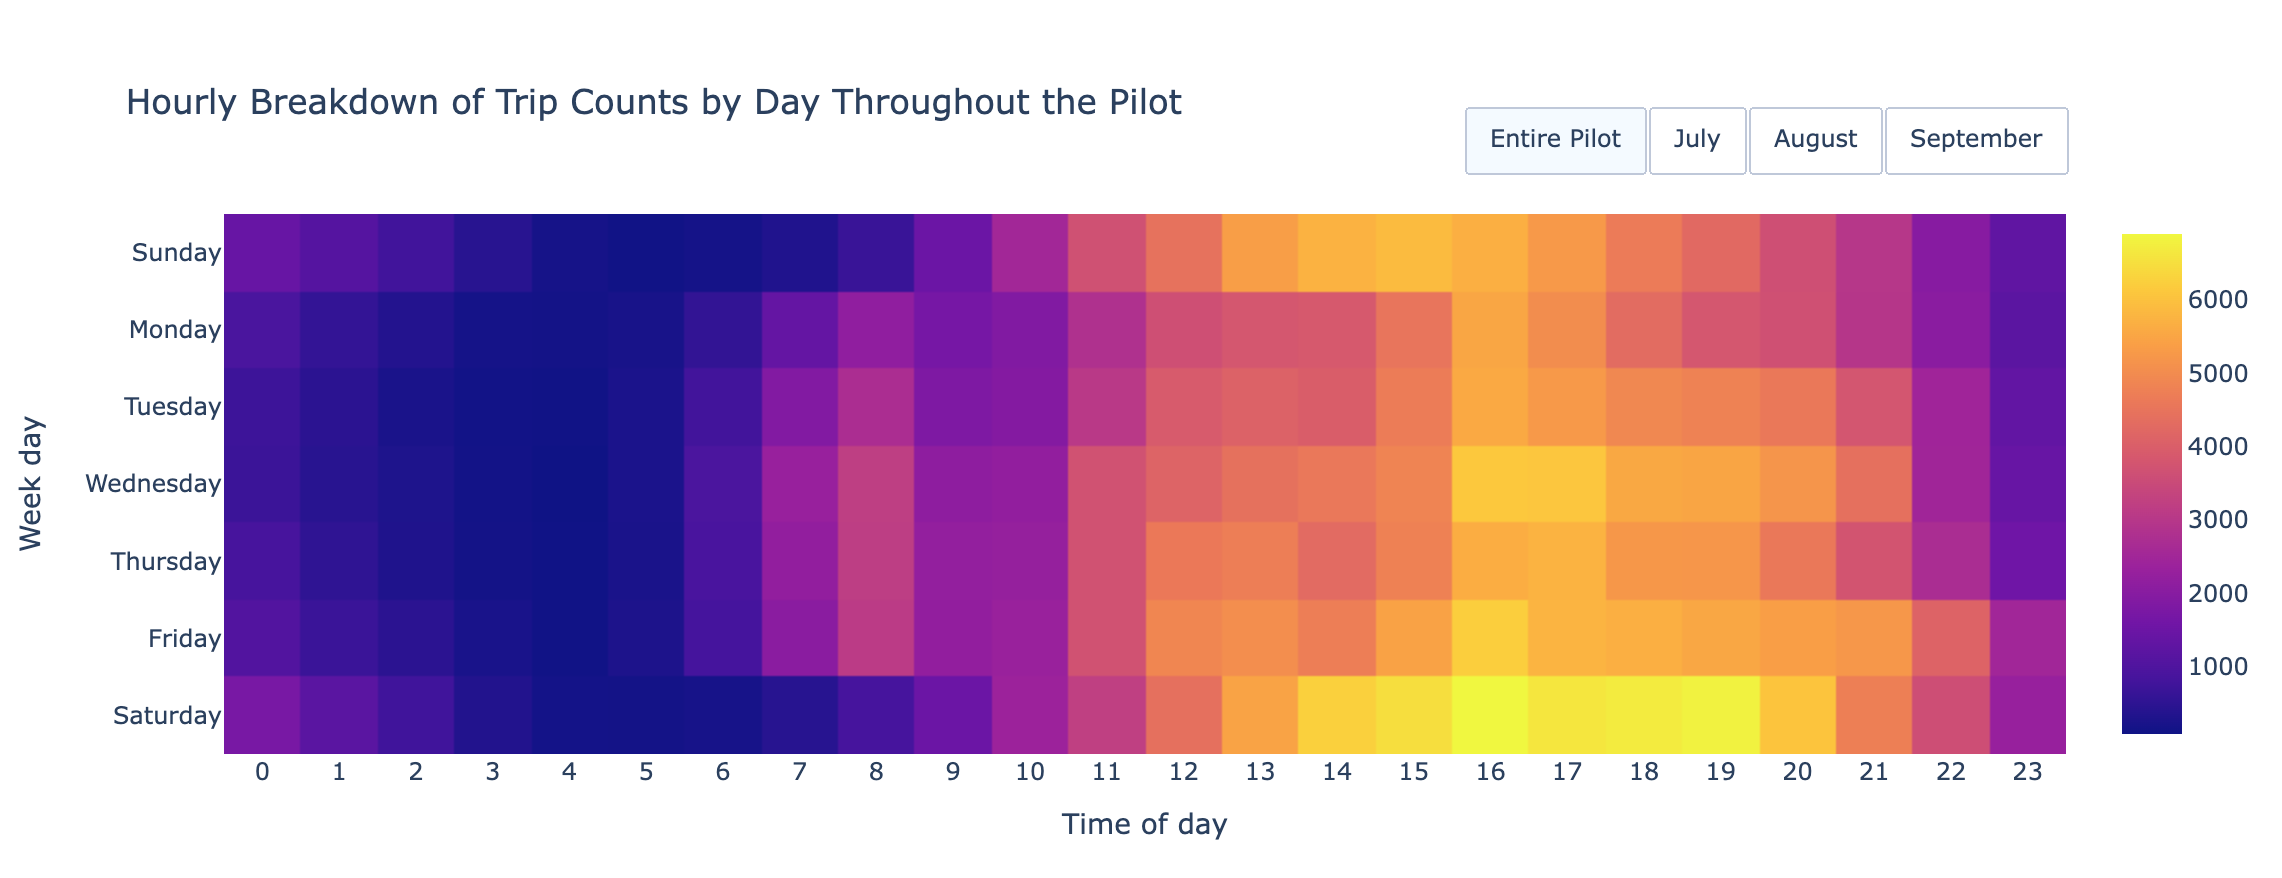
Our first conclusions were drawn from the heatmap plot for hourly trends in scooter and bike usage. Most notable, our suspicion on workday commute patterns was not confirmed, as the most popular hours occurred on Saturday afternoons or evenings between the hours of 2pm and 7pm. Key takeaways from this analysis for those who may want to attempt a scooter or bike trip themselves, there is likely to be a tougher time finding a vehicle during Friday and Saturday afternoons and early evenings.
From the trip frequency histograms, we saw a gradual uptake in usage about midway through July, a steady utilization throughout August, and peak days in September that quickly drop off in the final week. Fridays and Saturdays appeared to usually be the busiest days in terms of volume. Our summer events analysis did not appear to have a significant impact on trends, as we saw the top 3 most frequent days happen on September 13th, 14th, and 21st.
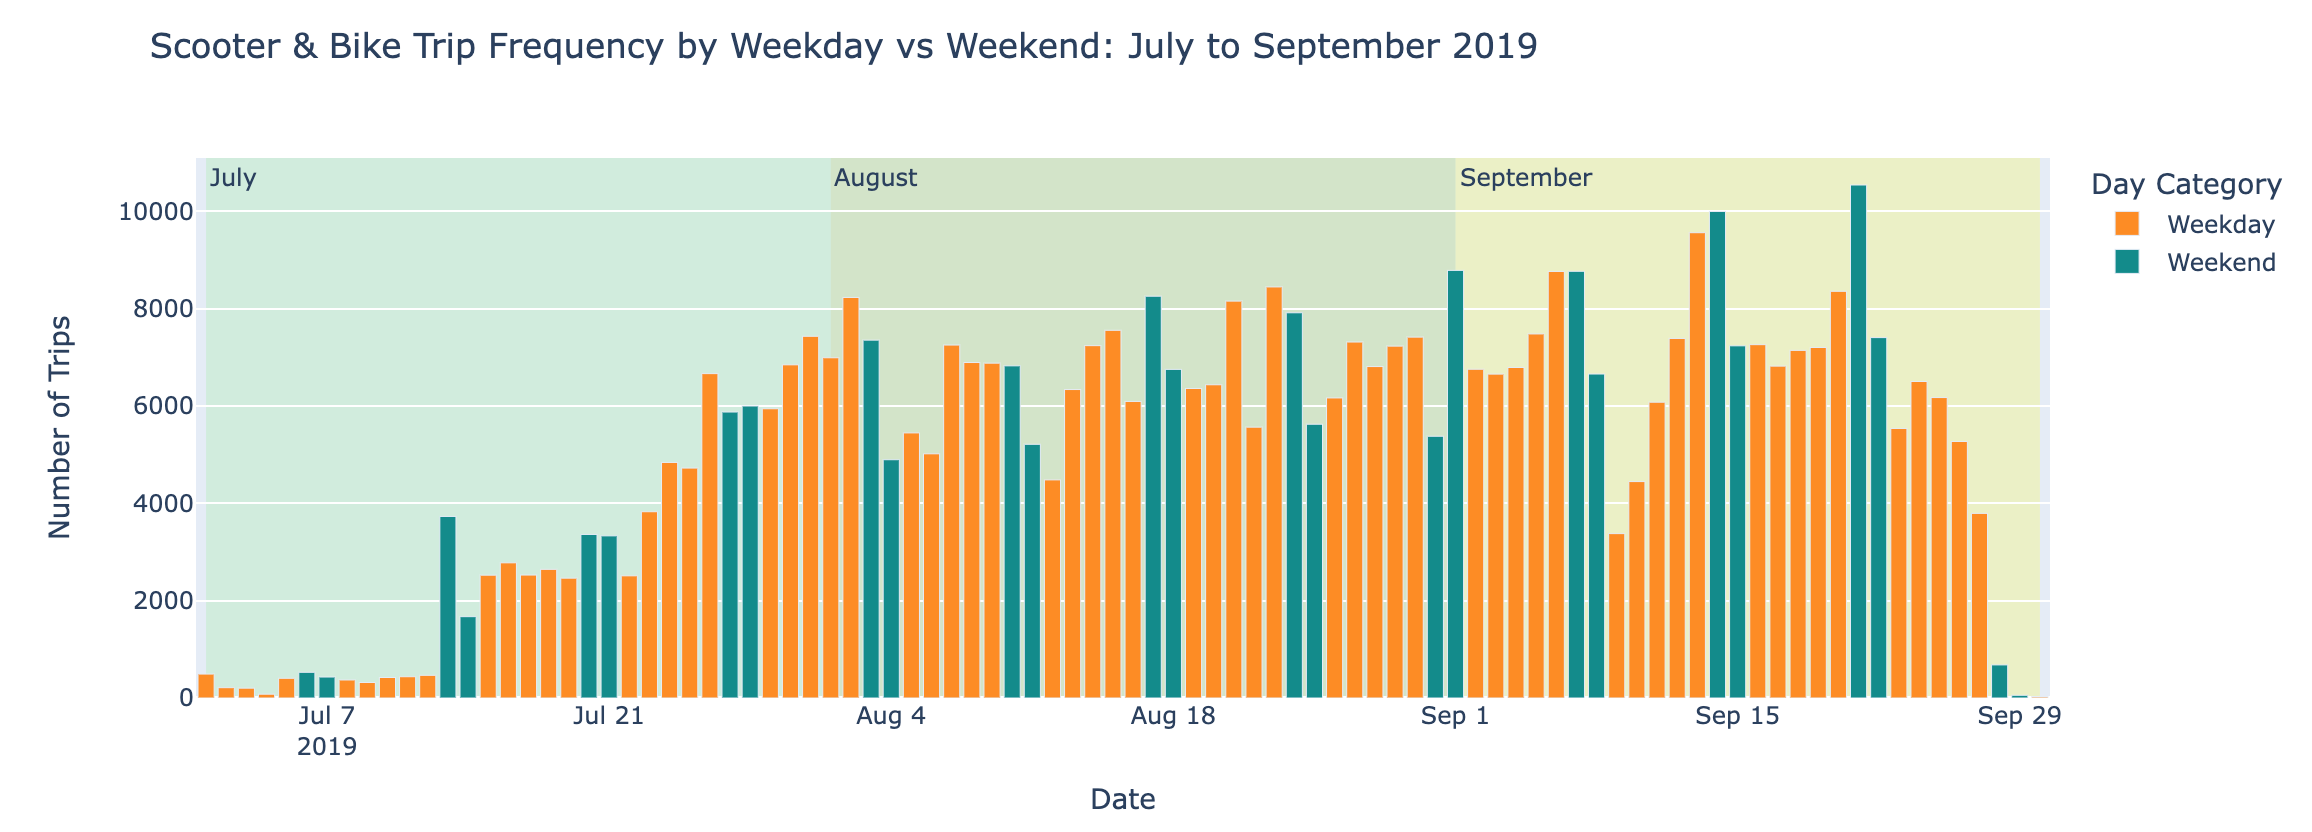
However, Stampede began only within the first week of the pilot. We did notice the first big jump in use happened during the last weekend of Stampede, which could be due to word of mouth or promotion of the service, though our leading hypothesis is that there were likely more vehicles introduced to the city on this day since we do not observe any scooter data before this point. Further background research specifically revealed events on the peak days in September that could be responsible for alternative transportation demand, such as downtown core road closures, a Calgary Stampeders CFL game, and on our busiest day: a Calgary vs Edmonton NHL game, country musician Eric Church concert, and Beakerhead weekend.
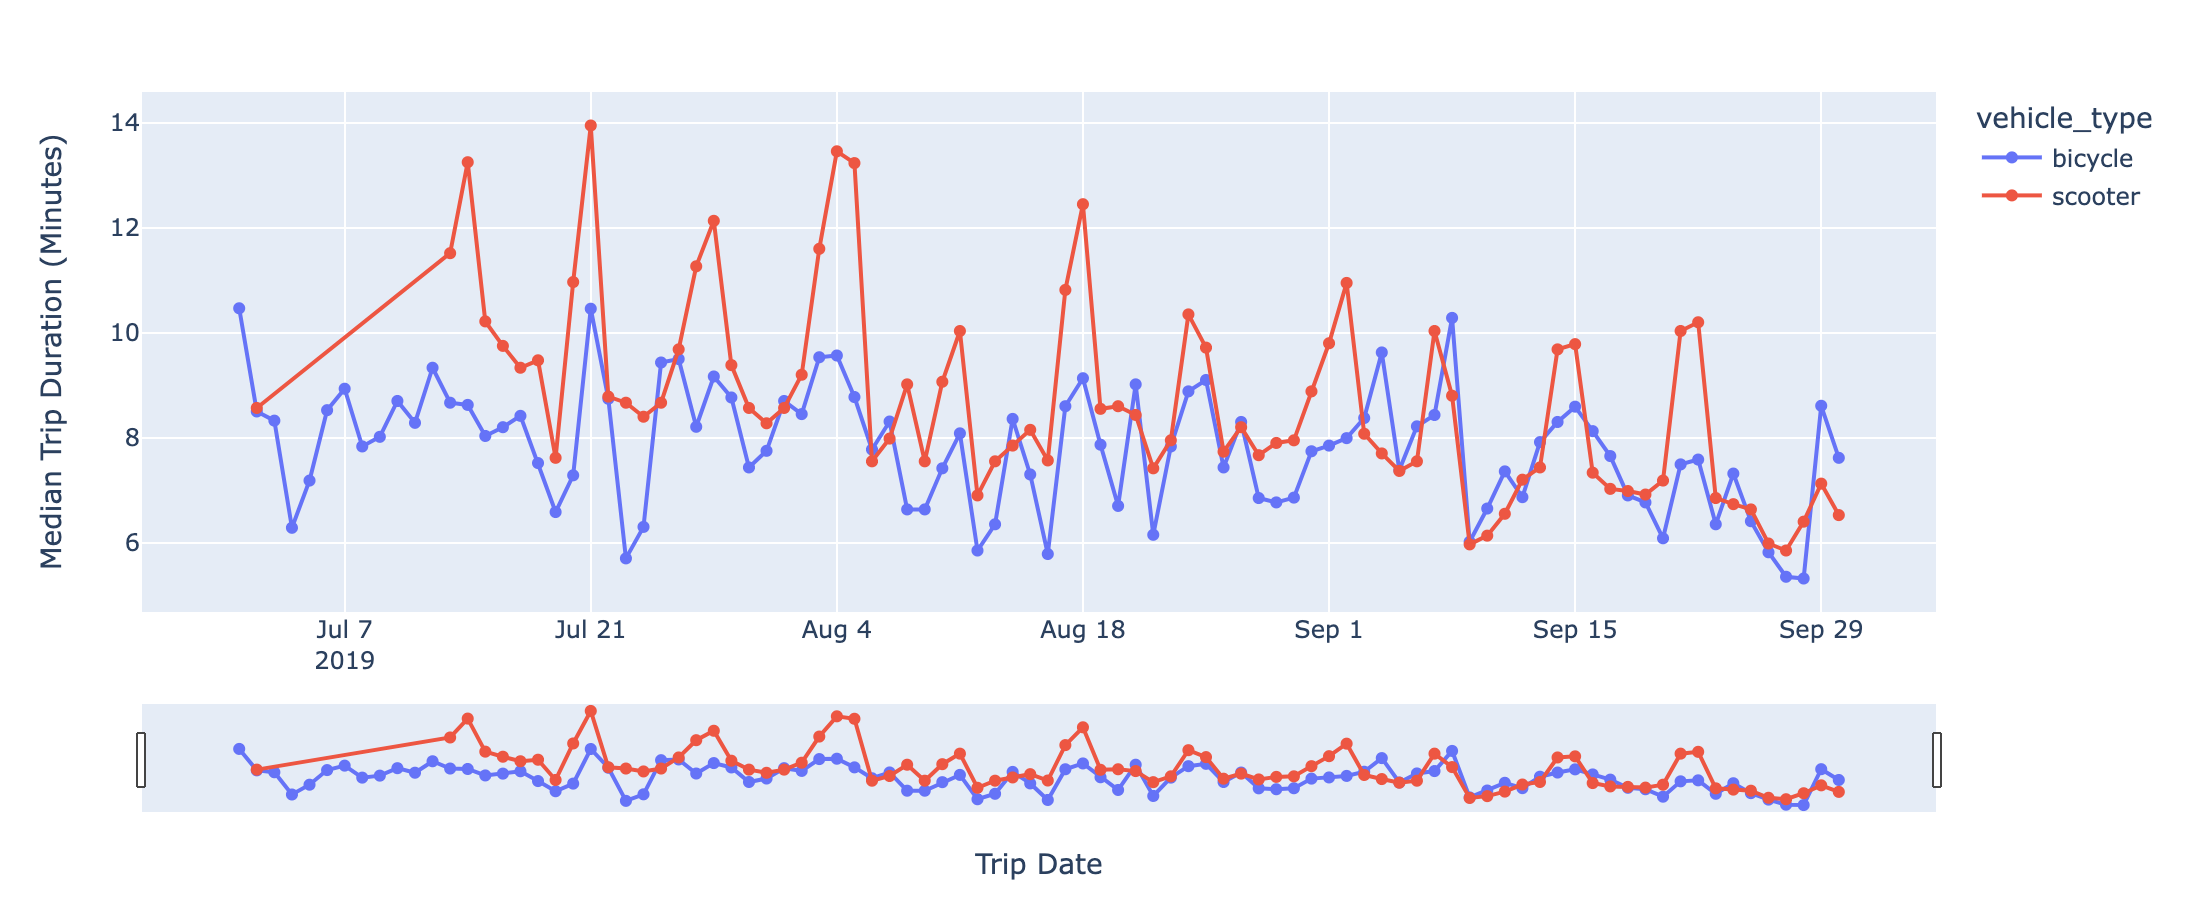
Our timeseries anlysis of the trip distance and trip duration revealed that, in general, users rented scooters for longer periods when compared to bicycles. This trend is also observed in the trip distance, as longer trips were identified in scooters relative to their bicycle counterparts. These trends were maintained until September, where we observed a sharp decline in trip duration and trip distances for scooter trips, relative to bicycle ones. This could be due colder temperatures or a natural winding down of the pilot itself. Interestingly, bicycle usage was relatively more stable than scooter usage, at least in terms of the distance traveled and the time taken to for each trip. This suggests that bicycles may have mostly been used to go to fixed locations e.g. work, resulting in more constancy.
Part 2: Hotspots and Availability
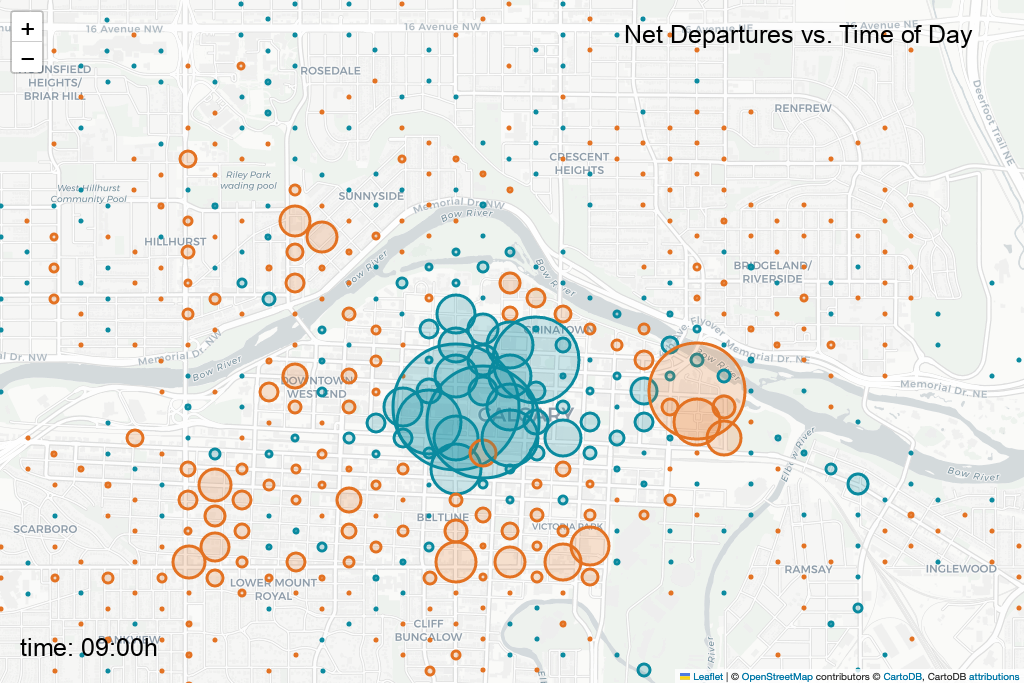
From our map visualization, it’s evident that the most frequented starting spots align with the top ending spots. These locations are in close proximity to key attractions such as the Bow River pathway, Stephen Avenue, the core shopping center, 17 Avenue, and East Village. They tend to cluster around shopping centers, restaurants, and walking paths. Surprisingly, we’ve observed that most of the CTrain stations lack popular pick-up or drop-off spots, indicating that e-micro mobility options, be it scooters or e-bikes, are predominantly used for leisure transport rather than commuting.
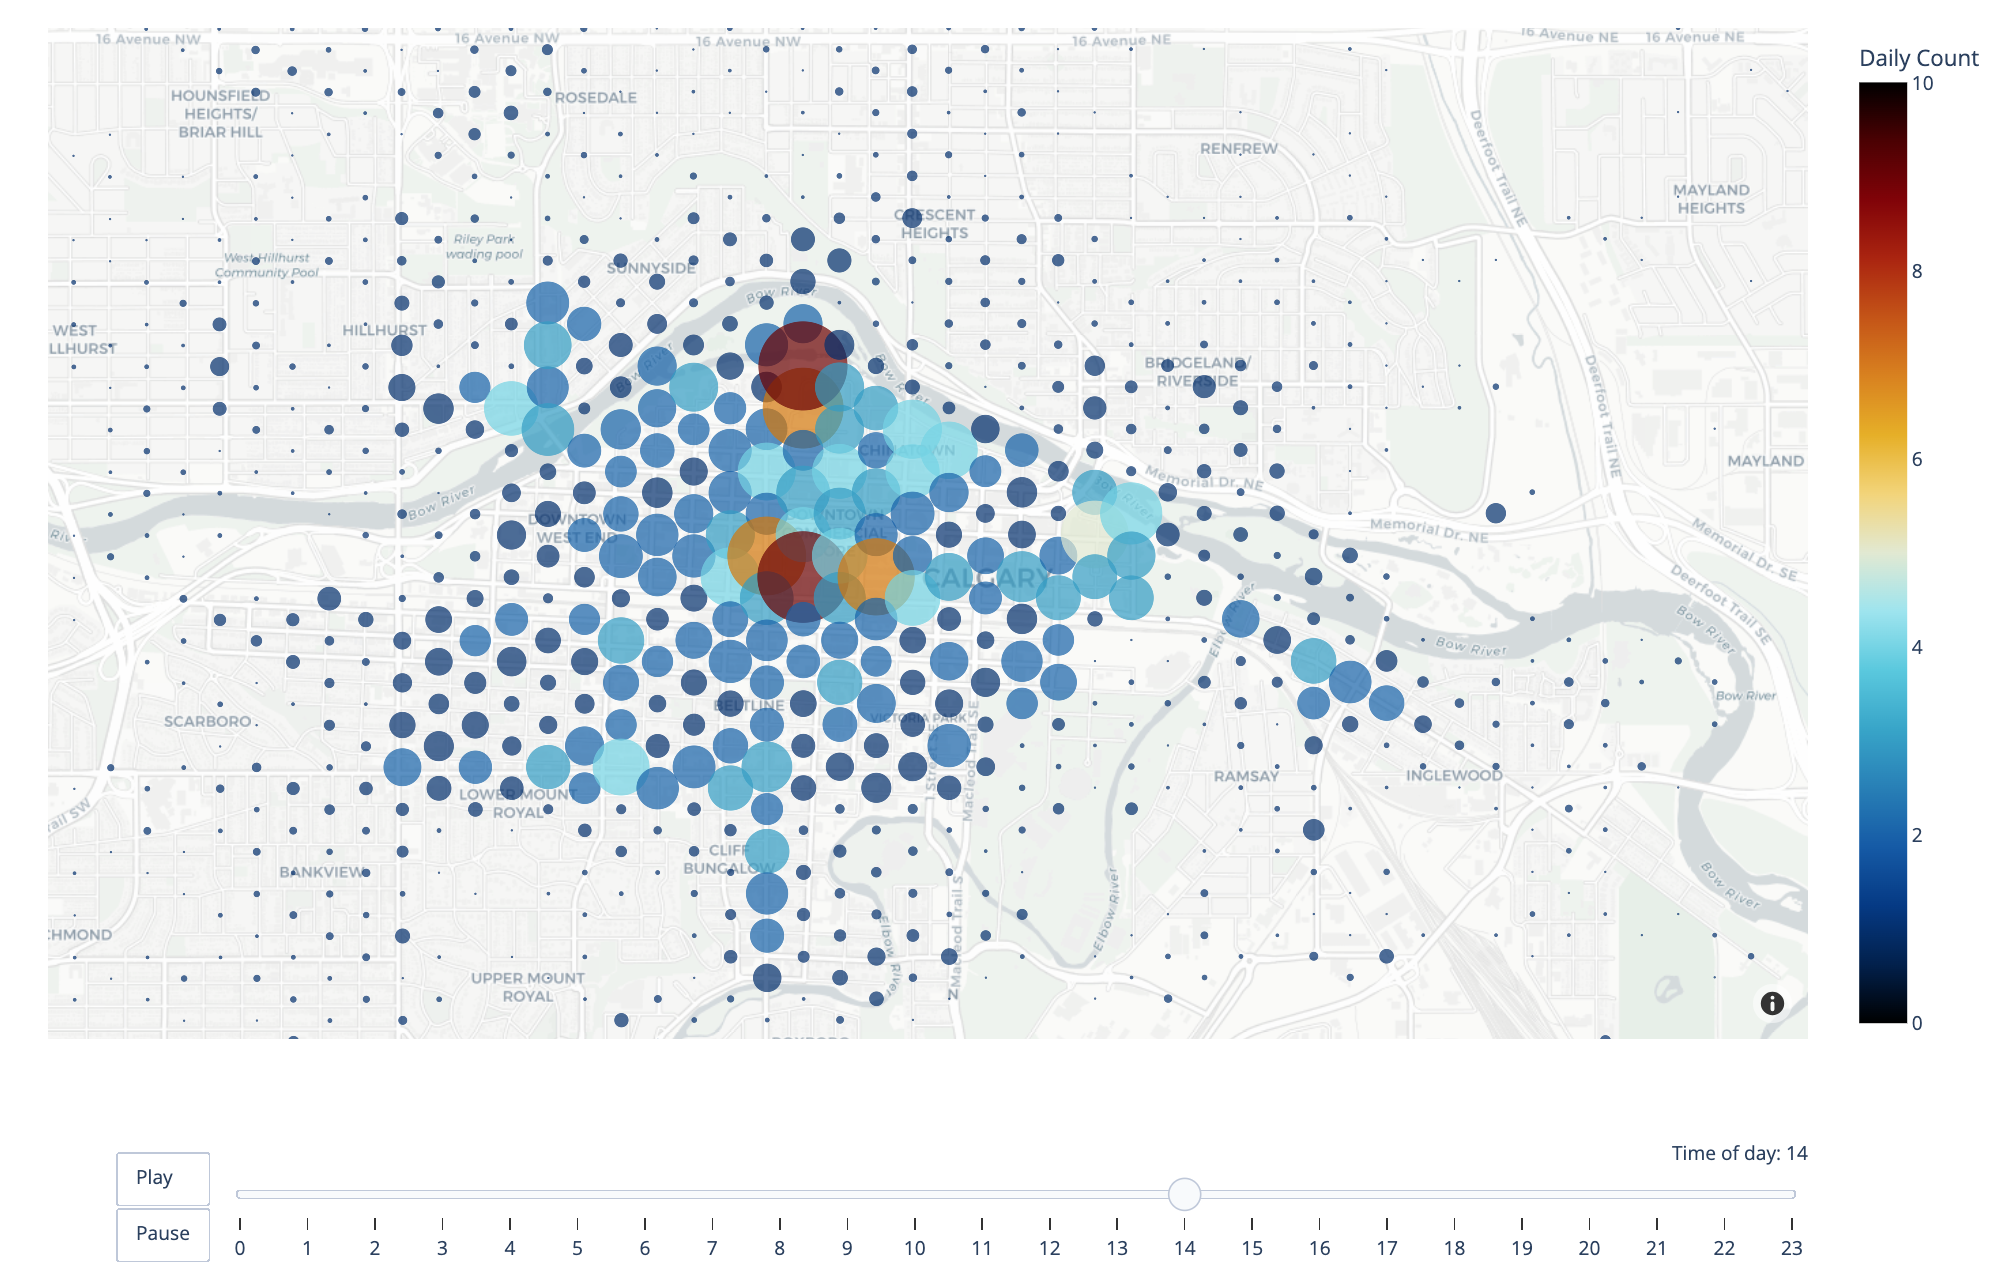
The animated geoplots revealed showed that the busiest hours were rush hours (7.00 AM - 9.00 AM and 3.00 PM - 6.00 PM). Lunch hour was also highly busy, particulary in the downtown core, indicating that the micomobiility vehicles may have been viable alternatives to walking and driving downtown during the pilot.
To promote the use of these e-micro mobility options and reduce reliance on personal vehicles, the city may consider strategic allocation of e-scooters or e-bikes near CTrain and bus stations.
The Data App
The data application built to share the results from this project can be found here