
Executives at a theoretical bike company are interested in reviewing the company’s performance over a three-year period (2016 – 2018). They want to know the sales activity within the company and gain insights into the various trends observed from 2016 to 2018. Insights into the revenue accrued per region, store, product category and brand, as well as the top salespeople and customers, are also required. To meet their demands, I decided to build a comprehensive, interactive dashboard to efficiently convey the required information.
Data Collection
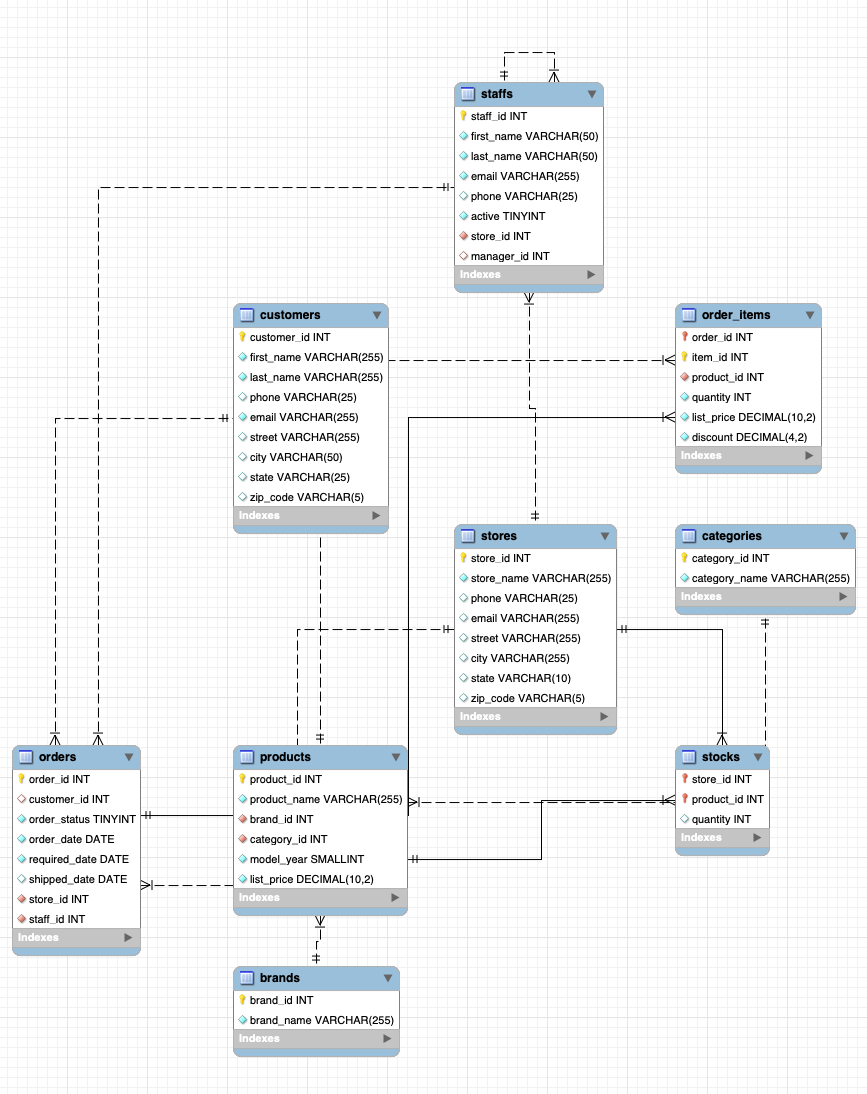
For this project, data was collected from the company’s internal database, which stores information about the bike brands, company stores, sales, and staff across the country (see database scheme below)
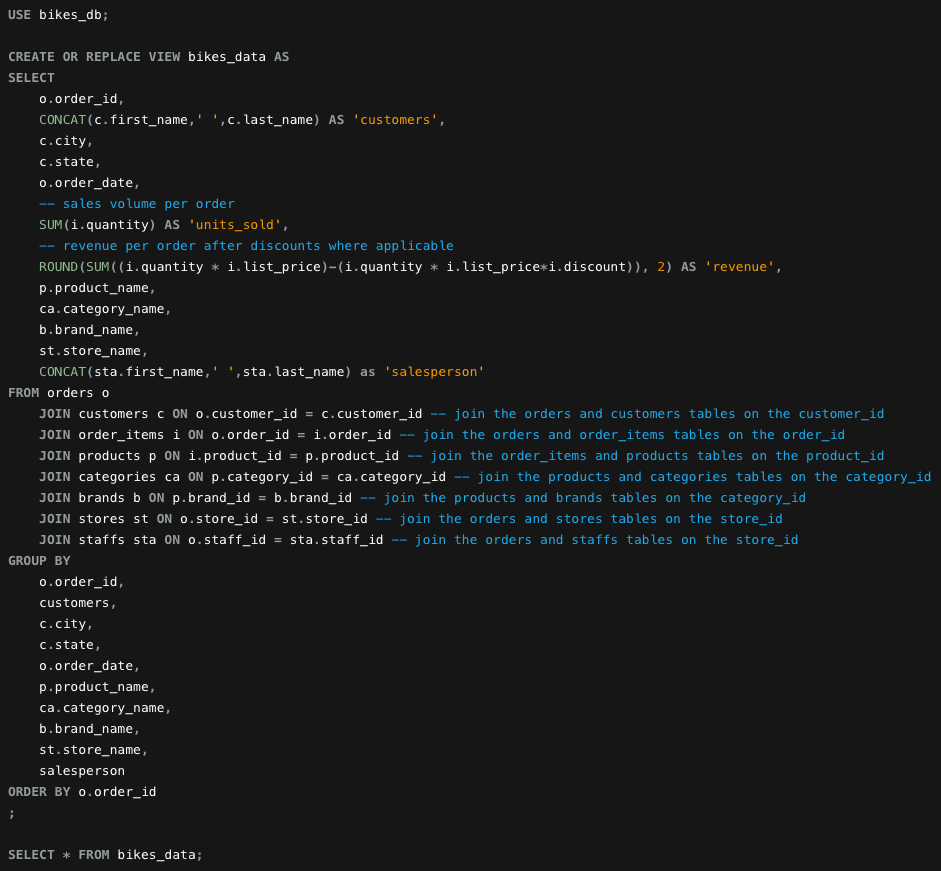
Data Ingestion and Cleaning using SQL and Microsoft Excel
The data from this query below was imported into Microsoft Excel using Power Query
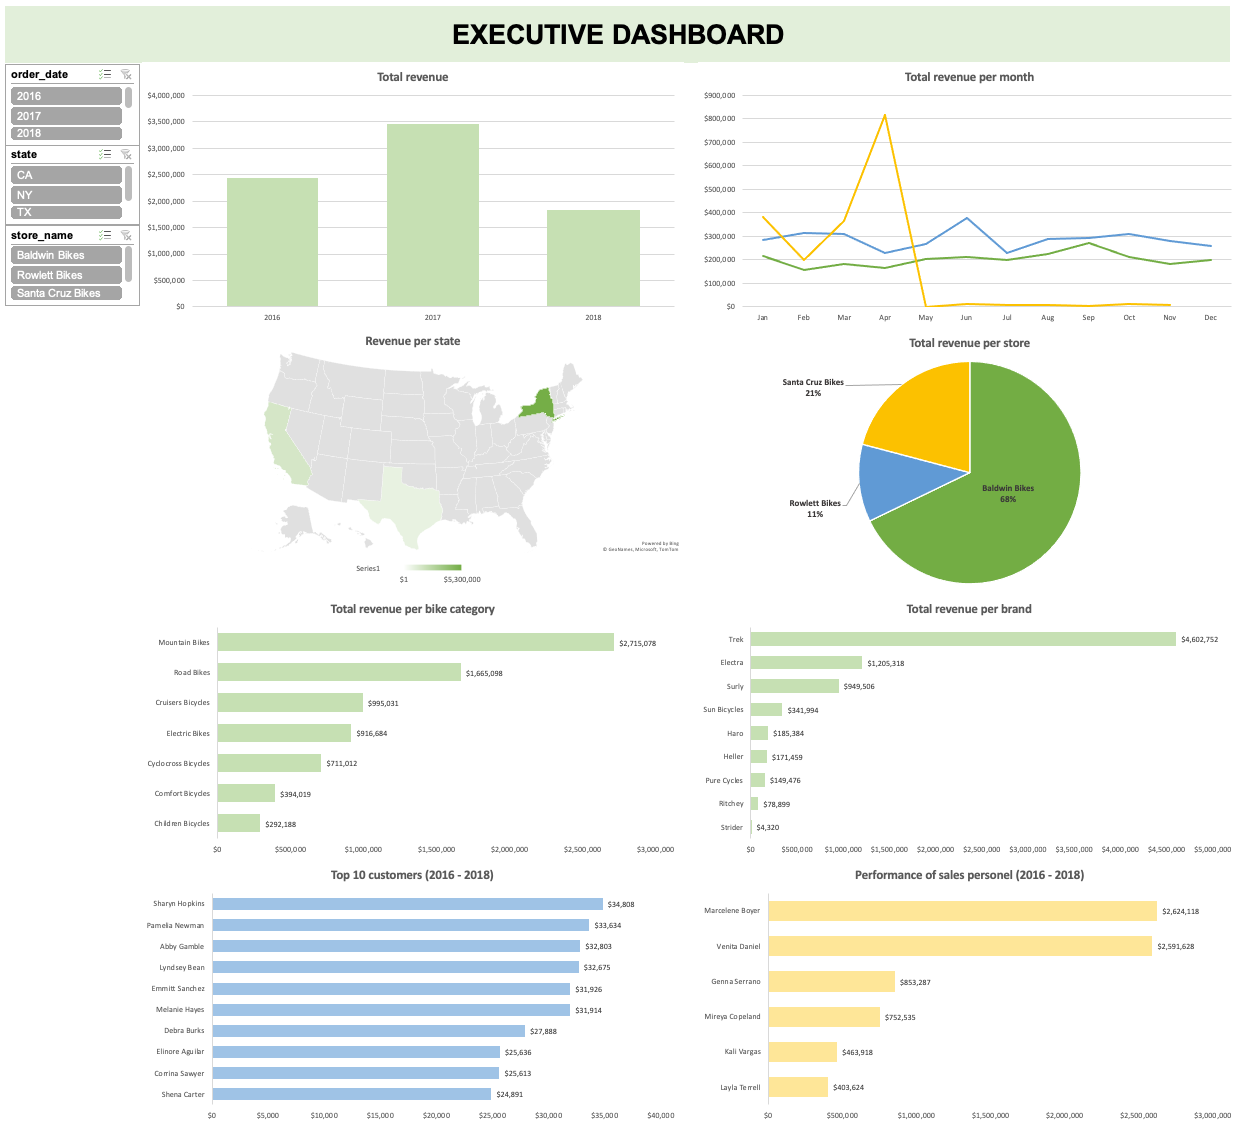
Data Analysis & Visualization
After importing the data into Excel, I checked the quality of the dataset paying attention to missing values and duplicate records. After ensuring the data quality was great (neither duplicates nor missing values were found), I went ahead to create a preliminary dashboard using pivot tables in Excel.
A more interactive dashboard was also generated in Tableau and can be seen here.