
The goal of this project was to analyze customer transactions in order to investigate and interpret customer behaviours of a certain supplier. For this project, I will use unsupervised ML methods to reduce the dimensionality of this data, and plot the resulting 2-D data, and investigate what the models are learning
Project Outline
- Data Ingestion
- Exploratory Data Analysis
- Principal Component Analysis
- Kernel Principal Component Analysis
- K-Means Clustering with Elbow Method
- Interactive Cluster Analysis
Data Ingestion
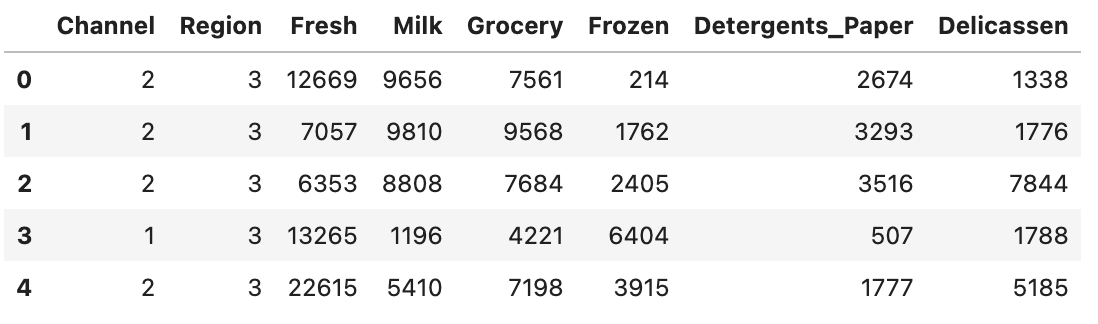
The dataset used was collated by Margarida G.M.S. Cardoso, and comprises annual spending across different types of retail products (e.g., Frozen, Grocery, Delicatessen, etc.) and can be found here. Below are the first five records in the dataset:
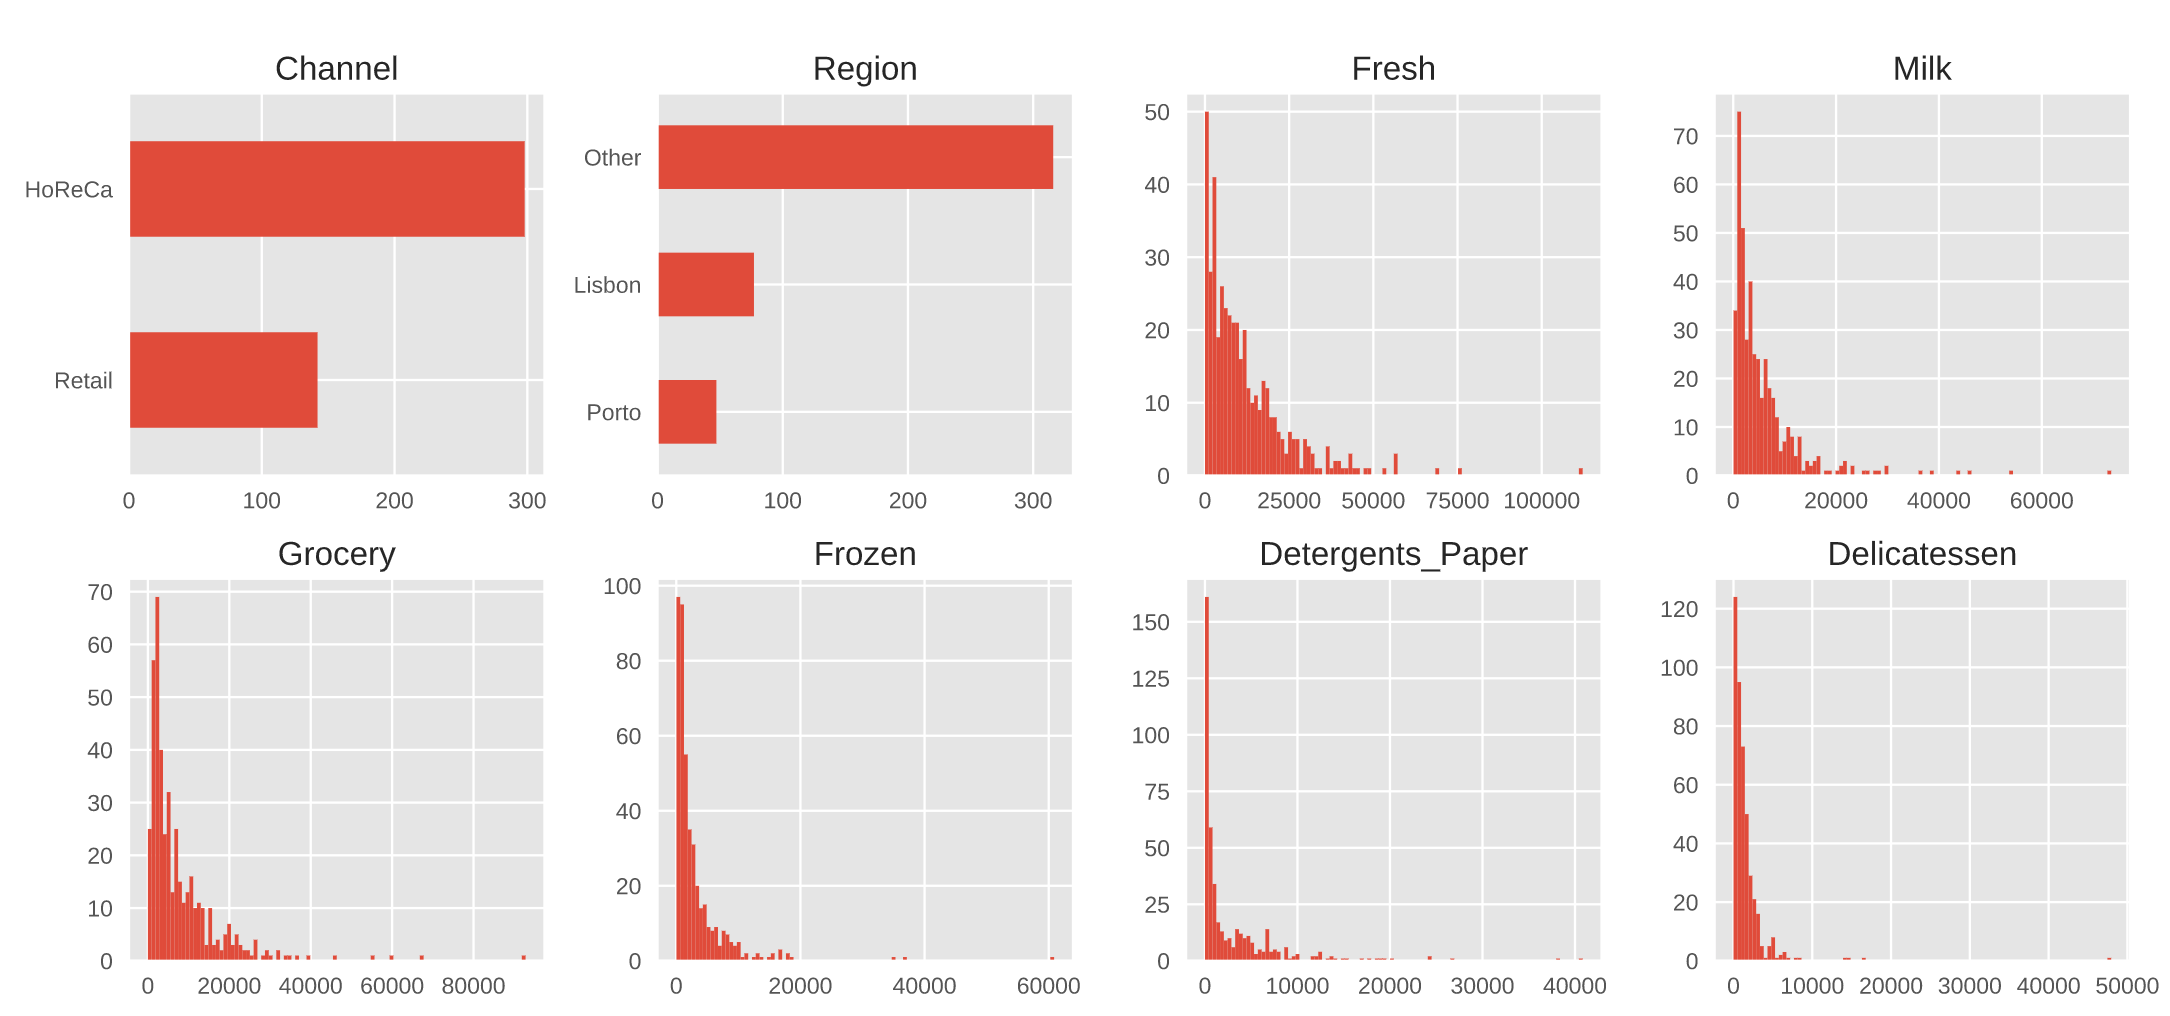
Exploratory Data Analysis
I began EDA by looking at the distribution of the variables, which revealed most transactions to be left-skewed and somewhat correlated.
Clustering Analysis
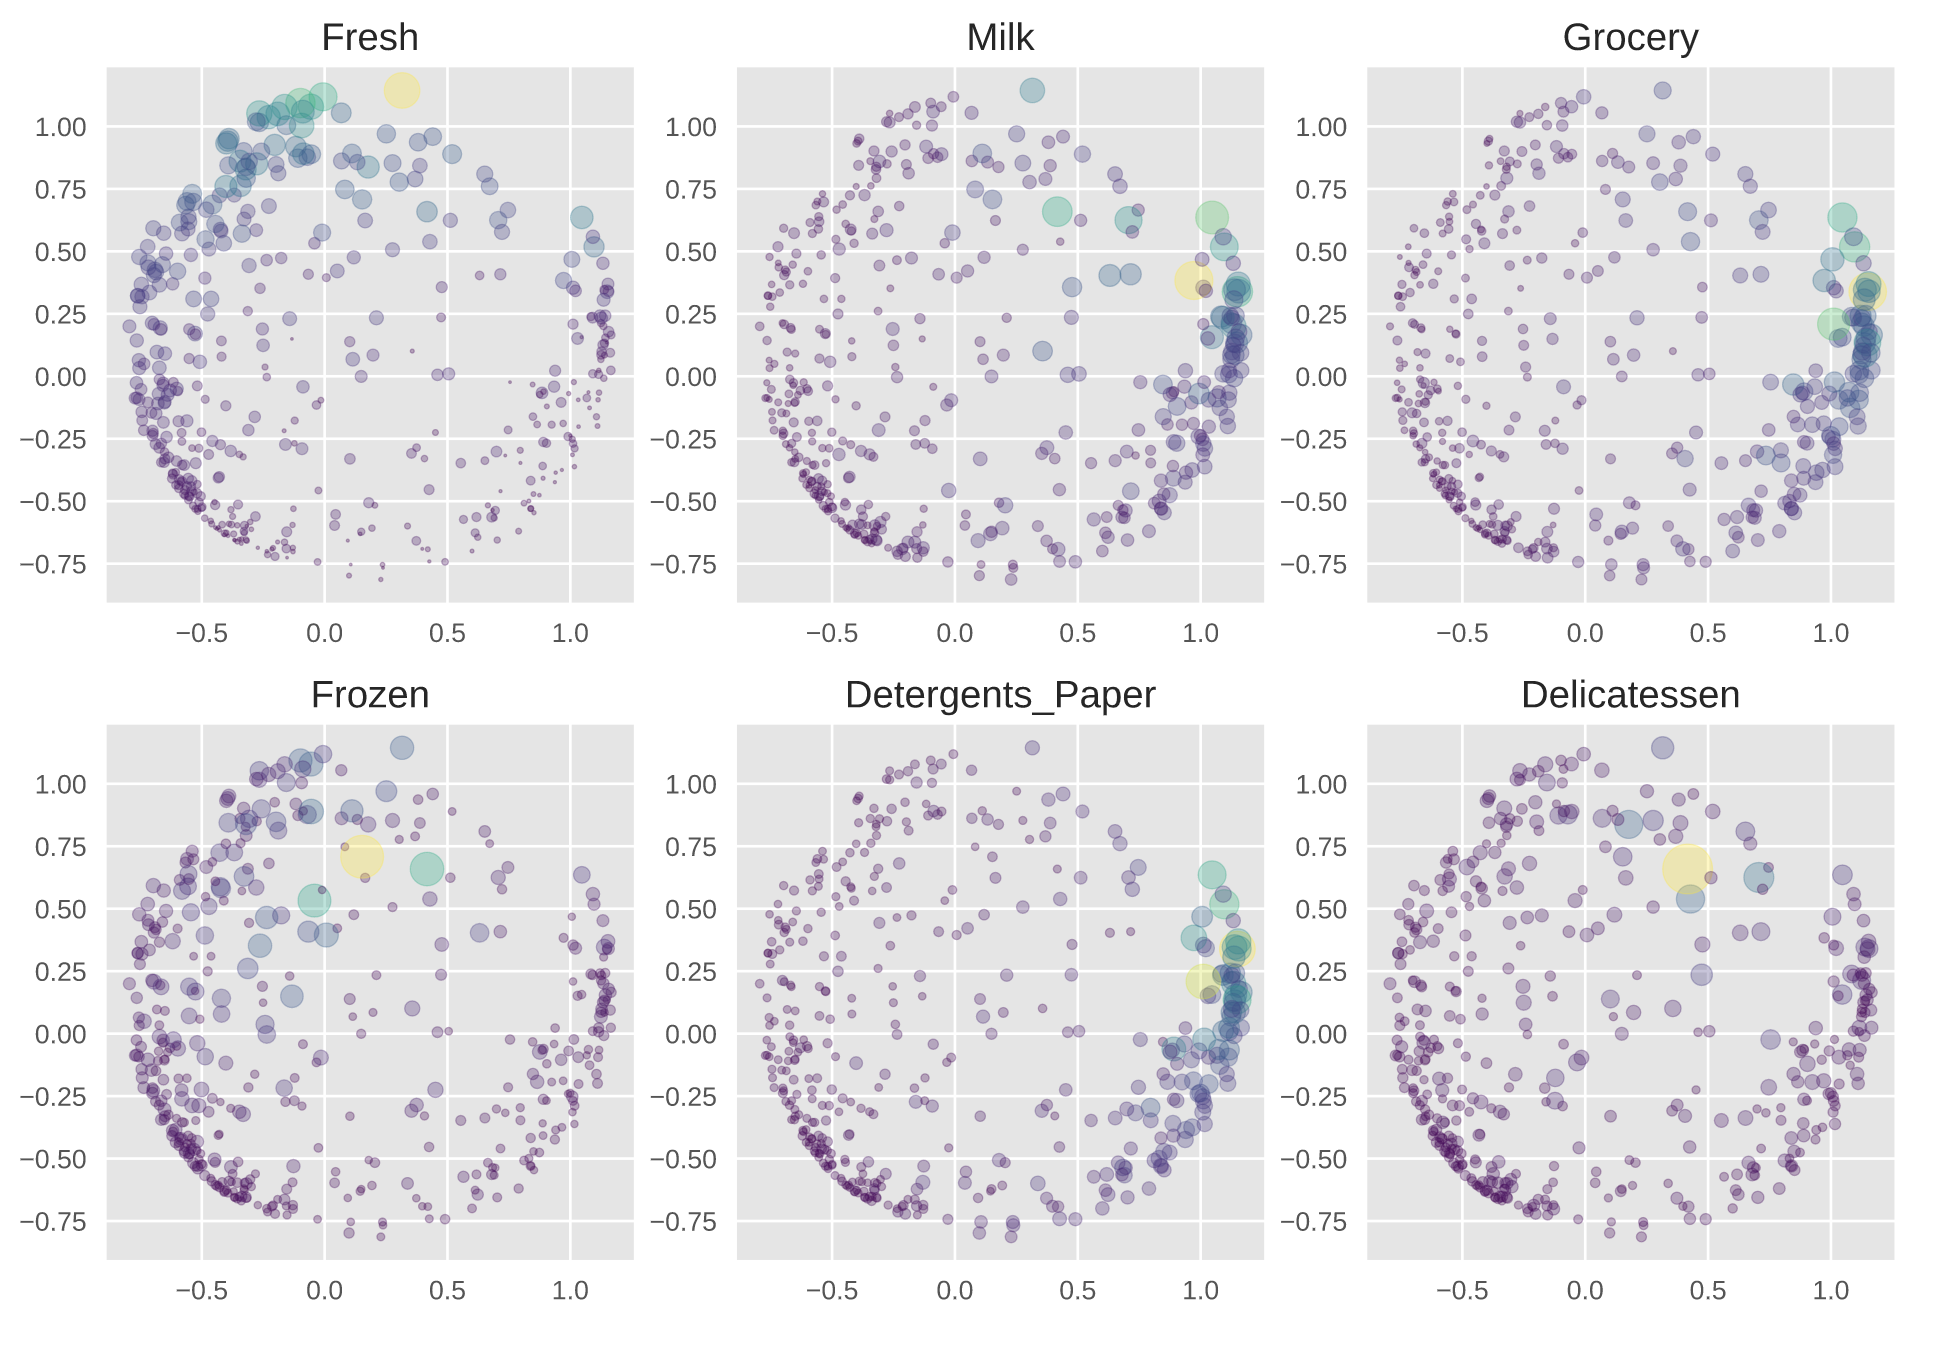
Prior to conducting the clustering analysis, I decided to reduce the dimensionality of the data using Principal Component Analysis. Unfortunately, this was unsuccessful, as the data was not linearly separable. Consequently, I proceeded to transform the data using a cosine function via Kernel PCA.
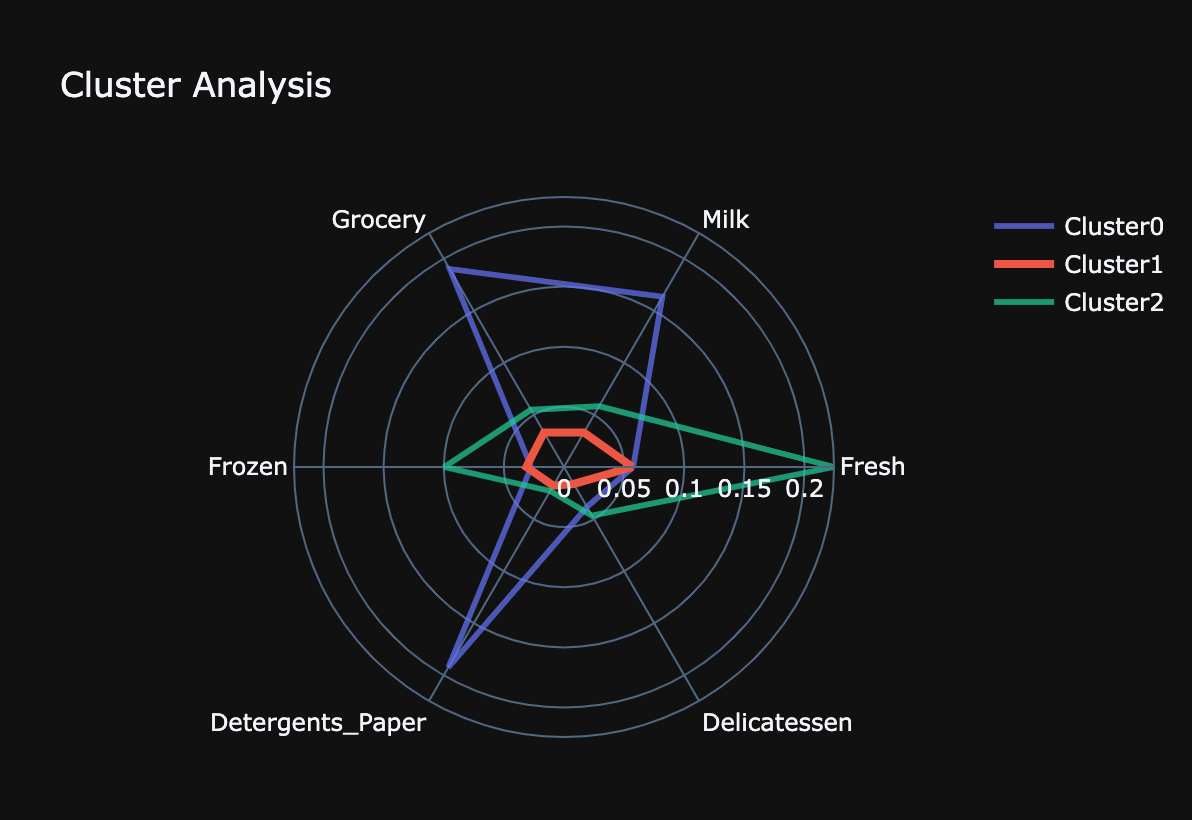
The clustering analysis was done using the KMEans algorithm (no_clusters=5), using the Elbow method to determine the ideal number of clusters. Three customer clusters were found:
Cluster 0: Customers with high spending power, who buy grocery, milk and detergent from this store
Cluster 1: Customers that buy items from all categories, but mostly spend money on fresh food. Consumers in this cluster have the lowest spending power of all clusters
Cluster 2: Customers with high spending power, that buy mostly fresh and frozen foods from the store
Suggestions for the owner
If the store was to use this to fine-tune their next campaign, they could should focus their attention to customers in clusters 1 to see a boost in sales.