Following my data analysis project on the global impact of the pandemic, I was interested in seeing whether global happiness was also affected by the virus.
The dataset used in this project contains updated data from the World Happiness Report currated by Kaggle user mathurinache. Data was collected over a period of 8 years (2015 to 2022).
Project Outline
- Data Ingestion & Cleaning
- Exploratory Data Analysis & Visualization
- Happiness Score Prediction using Regression
- Clustering Analysis Based on Factors Affecting Happiness
- Summary
Project Summary & Conclusions
Data Curation
Following data ingestion and cleaning, the dataset contained 10 columns and ~1300 records
| Variables | Description |
|---|---|
| Year | Reporting year |
| Country | Country name |
| Happiness Score | Happiness score |
| Economy (GDP per Capita) | Score based on the country’s gross domestic profit |
| Family | Score based on the country’s social support systems |
| Health (Life Expectancy) | Score based on the country’s life expectancy |
| Freedom | Score based on the citizen’s freedom to make life choices |
| Trust (Government Corruption) | Score based on the citizen’s perception of corruption in the government |
| Generosity | Score based on the citizen’s perception of generosity |
| Happiness Rank | The country’s overall performance relative to other nations |
Data Exploration and Analysis
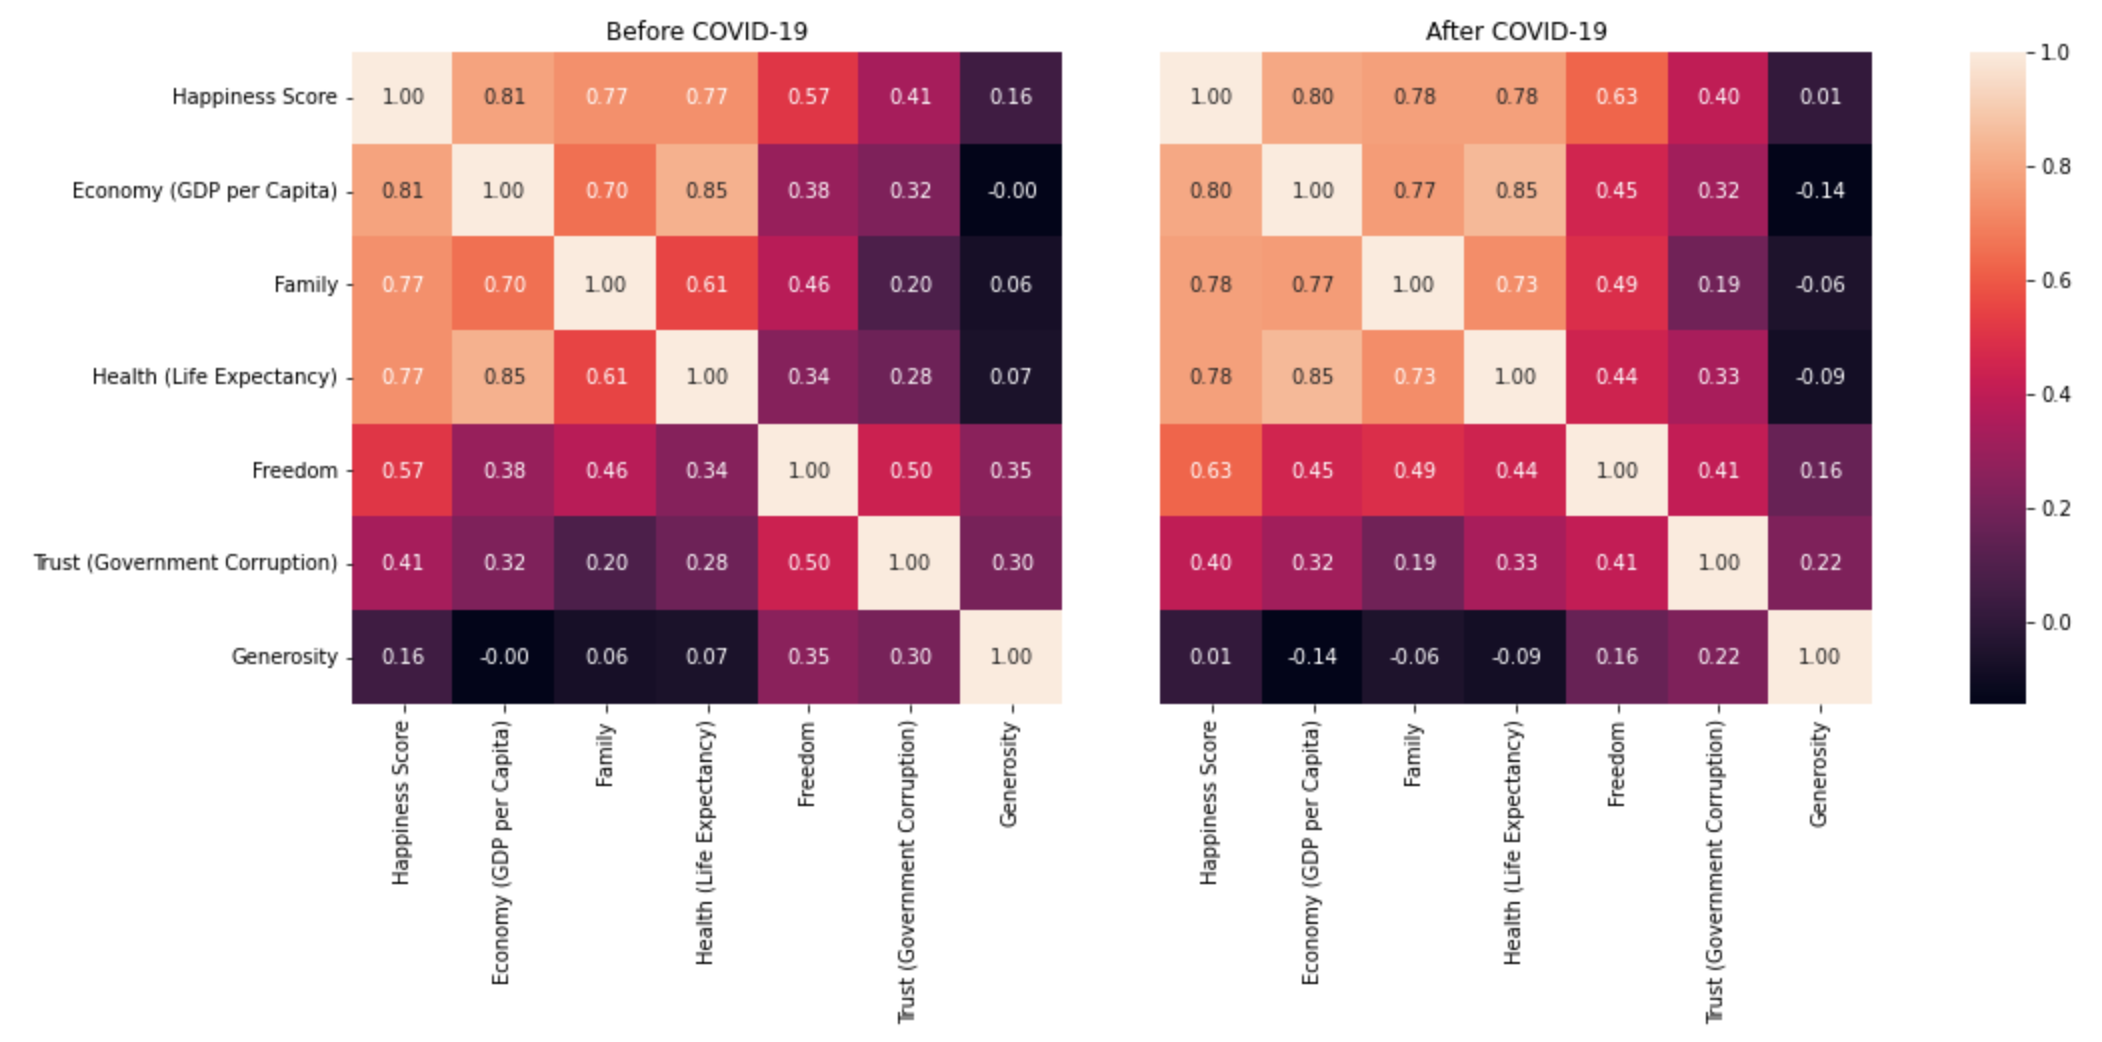
To investigate differences in global happiness before and after the pandemic, I divided the dataset into two periods (pre: 2015 to 2018 and post: 2019 to 2022). Overall, no significant changes were observed in happiness ranking between both periods.
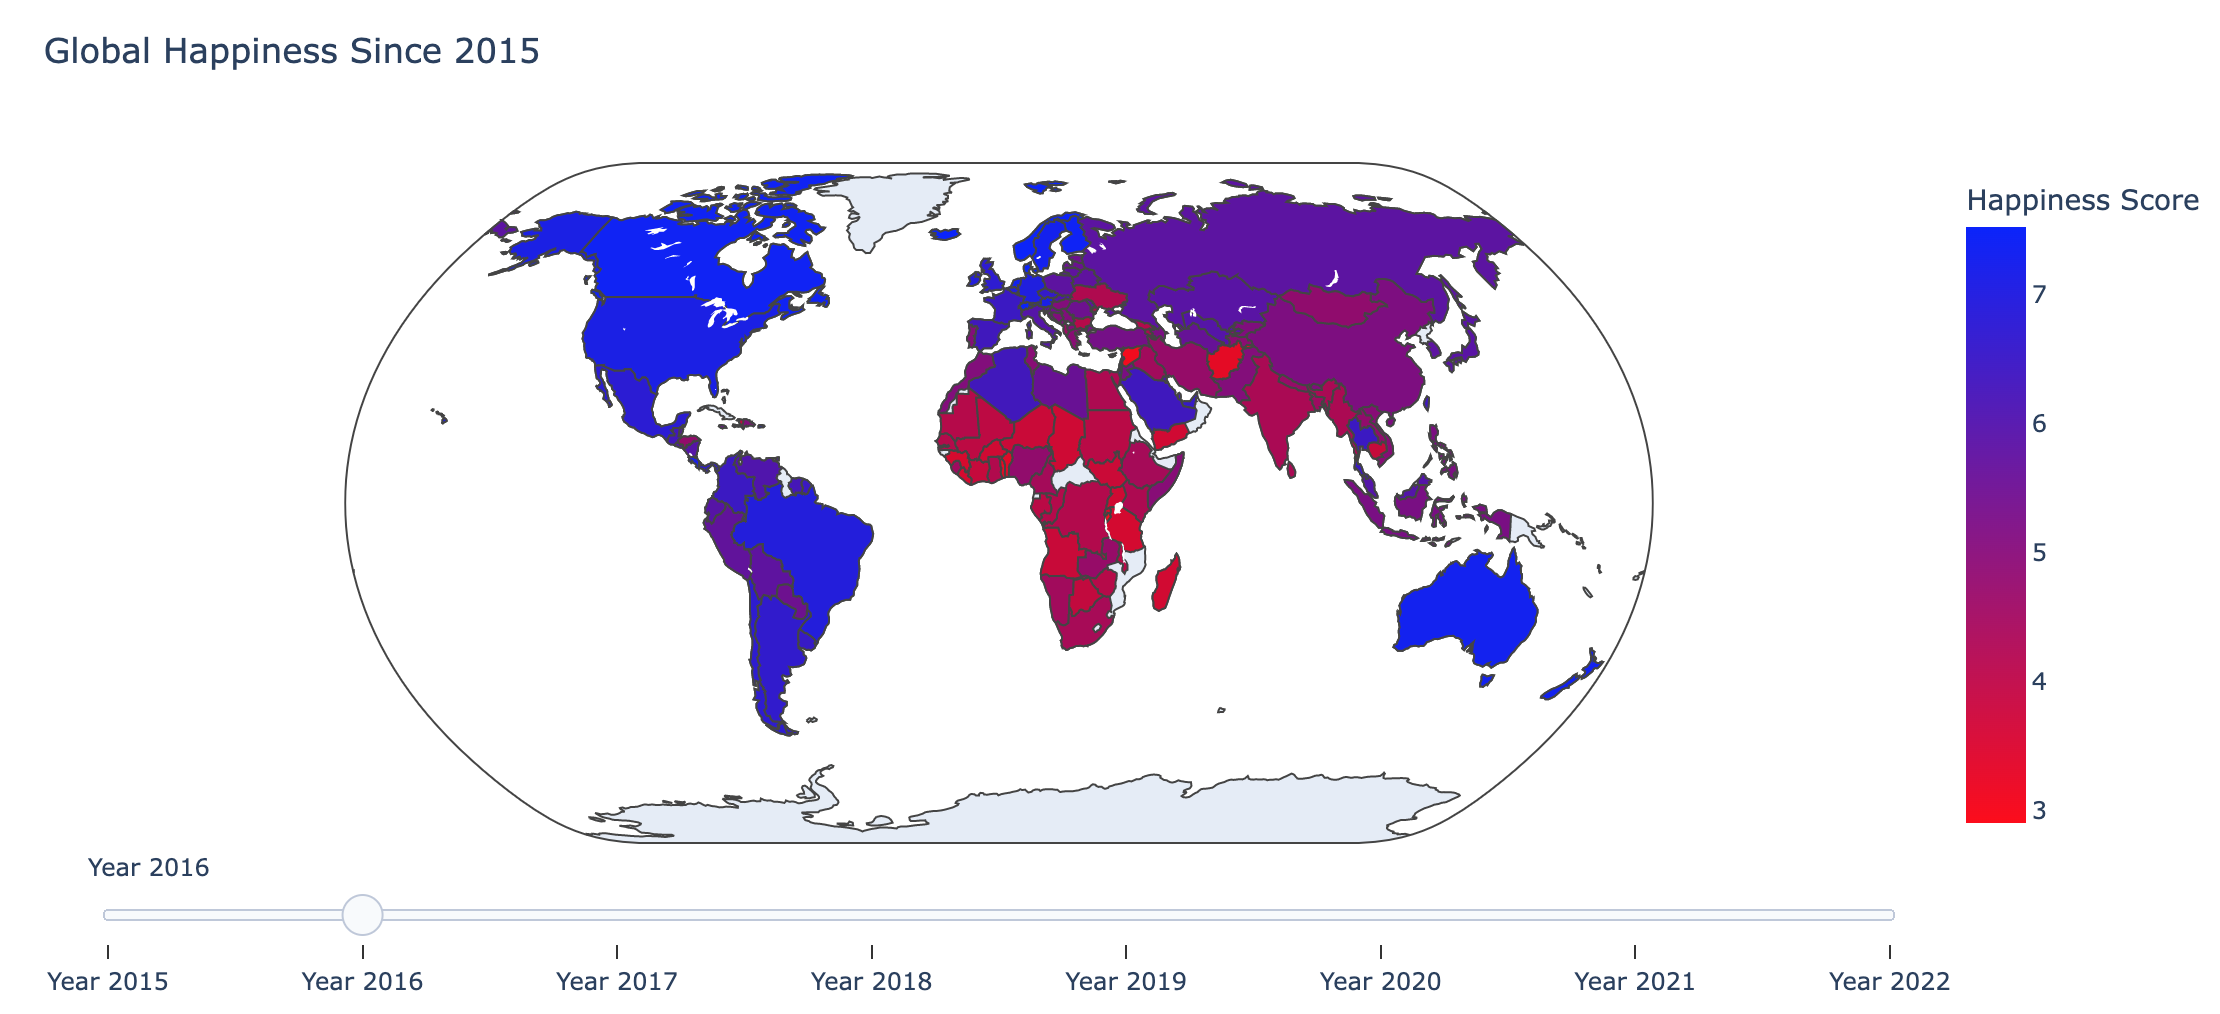
![]()
Generally, developed countries, including the US, Canada, Australia and Scandinavian countries (Norway, Findland) achieved the highest happiness scores across the globe. On the other hand, third wold countries, particularly African nations, are reportedly the least happy in the world.
Regression and Clustering Analysis
Following EDA, I evaluated the performance of five regression models in predicting a nation’s happiness score based on its economy, and other factors
Results:
| Model | Accuracy (%) |
|---|---|
| LinearRegression | 77.1 |
| SVR | 79.5 |
| DecisionTreeRegressor | 54.6 |
| RandomForestRegressor | 78.4 |
| MLPRegressor | 72.2 |
Overall, the SVR and Random Forest models performed better than other regression models with prediction accuracies of ~80%. The Decision Tree Regressor performed poorly compared to other models with an accuracy of ~55%.
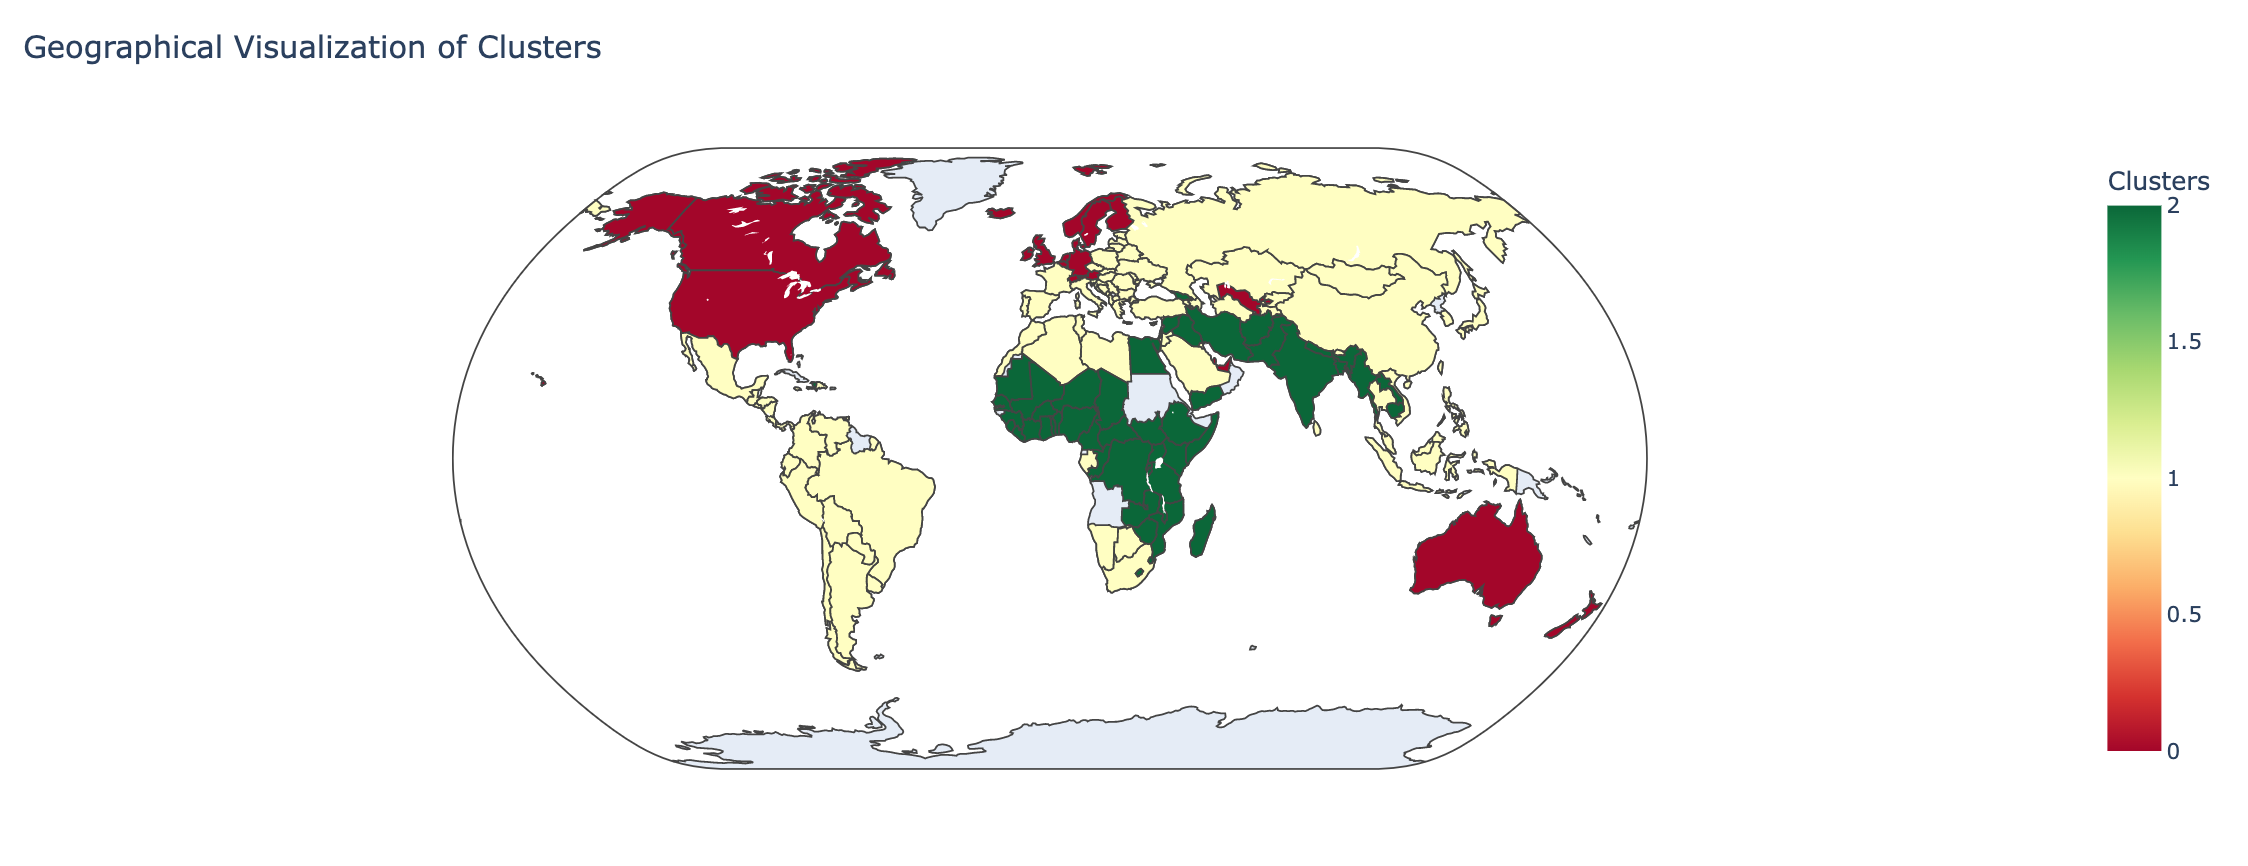
I also wanted to tease out the characteristics that separated “happy” countries from other nations of the world. Consequently, I conducted a clustering analysis on the dataset using the KMeans algorithm. Interestingly, I found that global happiness is highly correlated with a countrie’s GDP, which in turn influences other factors considered, including life expectancy and generosity. Therefore, a bias likely exists in the way we as humans determine happiness on the global scale.